I built a research repository in Jira and wanted to get my process down in writing for those in the same boat I was in: weighing the pros and cons of Jira without a guide. This article is part two. For part one describing the pros and cons go here.
Jira was not intended for the purposes of a research repo and requires a few workarounds (as well as ignoring certain aspects of Jira targeted to software development). Here is how we made it work for us.
Mapping the repo data fields
The most important step is to map out your fields before diving into Jira. Every field, field type, and select options. In mapping out our fields we drew inspiration from Kate Towsey, Tomer Sharon, Emma Boulton, the Research Ops community, and Brigette Metzler. These smart folks are very generous with their knowledge and ideas and I highly recommend a deep dive into their articles.
Our data is input as “observations”. Following Tomer Sharon’s atomized data philosophy the observation is the smallest functional size of a self-contained data unit. One user experience interview might generate anywhere from 1-20 — or more! — individual observations.
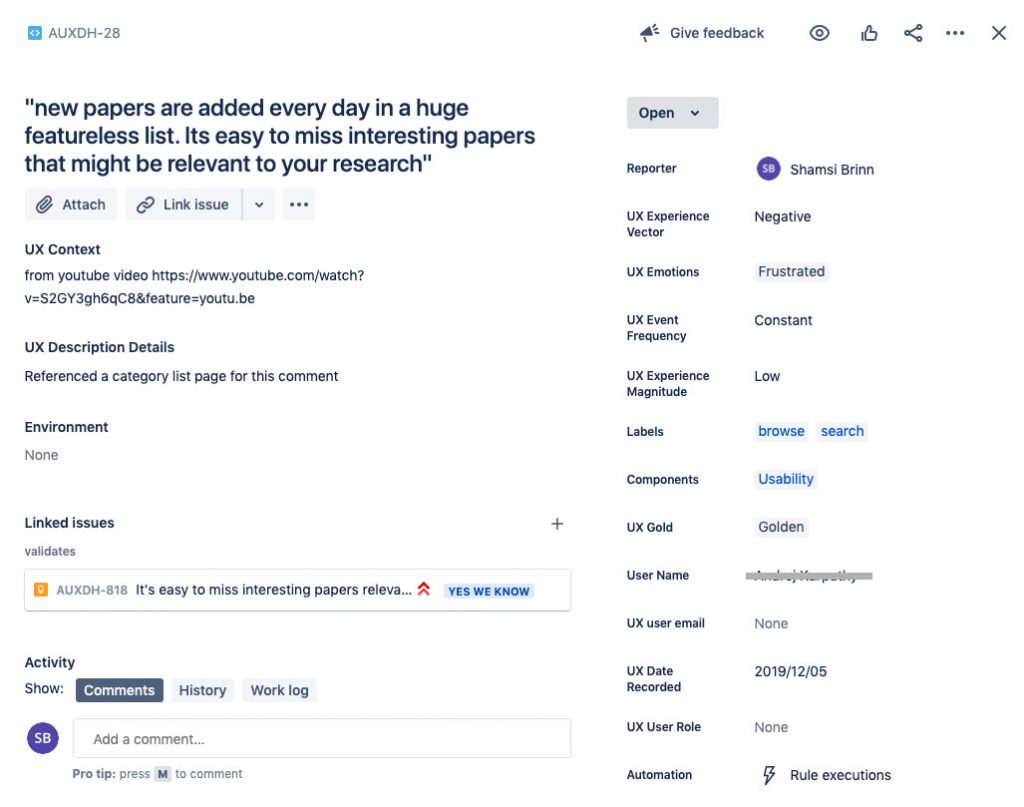
Here are a few highlights from our final field list that might help you start brainstorming what need:
- Summary (required by Jira): This field is prominent in Jira and we use it for the observation itself. It has a limit of 245 characters, so if its too long we let observations spill over into an additional description field.
- Context: How the data was gathered, for example a feedback form, survey, etc. We link to the original source whenever possible to maintain a clean audit trail.
- Description: We only use this field when the Summary field isnt long enough so its most often empty.
- Status: We dont use status for observations but it’s required by Jira. We hide it in as many views as possible but can’t make it go away entirely.
- Experience Vectors: For example Negative, Positive, and Mixed.
- Labels: Probably our most important field. This is where we tag observations for future searchability. In Jira this field is arbitrary so we ensure we use matching labels across observations by maintaining a shared reference list.
- UX gold: used rarely, only for the very finest, most highly valued observational wisdom!
- Cleared: This was a field we added later when we realized we were capturing some wonderful quotable quotes that we wanted to use in communications. We use this field to indicate which quotes we have permission to use.
This is what our Observation issue screen in Jira looks like:
Once you have mapped out your fields you are ready to dive into creating the research repo.
Creating a custom project
Confluence has good documentation on each step which I have documented the links below. It took some trial and error for me to figure out the right order because each step builds on the last. If you arent familiar with building Jira projects then following the order below should save you time.
Note that all instructions are for Jira classic projects only, not next-gen. Next-gen projects have fewer configuration options and are not appropriate for the purposes of a user experience repository.
- Start by creating a new classic Jira project.
- Next create all of the new custom fields
you identified a need for in the mapping step. Name your custom fields
something obvious and easy to find when you search for them in step 4,
as you’ll need to constantly find them among a list of generic Jira
fields as well as custom fields created for other projects. I prefix all
of mine with ‘UX’.
https://confluence.atlassian.com/adminjiracloud/adding-editing-and-deleting-a-custom-field-776636410.html - Create the issue types you will need. I use two issue types in my repo: “Observation” and “Insight”. https://confluence.atlassian.com/adminjiracloud/adding-editing-and-deleting-an-issue-type-844500747.html
- Create a new custom field context to group an issue type with it’s relevant fields. Because Im using two issue types I needed two custom field contexts.
https://confluence.atlassian.com/adminjiracloud/configuring-a-custom-field-776636423.html - Create a screen to control how the fields display to your repo users. I have two issue types so needed two screens.
https://confluence.atlassian.com/adminjiracloud/defining-a-screen-776636475.html
For quickly editing your screens create a new issue, open it, then click “configure” in the issue window: https://confluence.atlassian.com/jirasoftwarecloud/configure-field-layout-in-the-issue-view-961798059.html - Optional: create boards for each issue type. I use a backlog view for Observations and a Kanban board for Insights. If you decided to go with a next-gen project you also have the option to create an agility board. I wish classic projects had the agility board option but they do not (yet!).
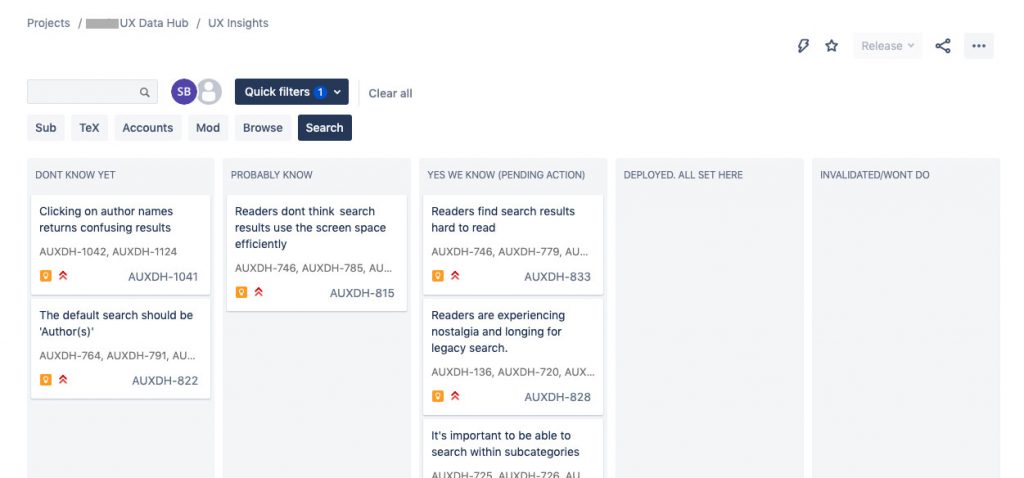
Jira Boards (Kanban and Backlog) for observations and insights
We use two different boards for viewing our data. For Observations, a simple backlog list view works best. For Insights we use a Kanban board so we can move them through stages of validation.
As patterns emerge within the user observations were collecting then we create Insights to group them. To group observations to an Insight we use the Jira linked issues field.
In our Insights Kanban board we use the following stages of validation: Dont know yet, Think we know, Yes we know, and All set. We also have a fifth column for insights that were proved incorrect: Invalidated/Wont Do. We don’t want to delete them because we might forget and repeat our work again.
Managing data via imports
Jira offers a helpful import function that can save you a lot of time. It uses the csv format, so it’s ideal if your data collection software can export into excel or csv. When we run a Qualtrics survey, for example, we export the data as a csv, map it to our Jira repo fields, and import it all at once.
Jira also offers the helpful option to bulk edit issues after retrieving the results you want to edit via JQL query: https://confluence.atlassian.com/jirasoftwarecloud/editing-multiple-issues-at-the-same-time-902499024.html. It’s perfect for Friday fuzz-brain ‘oops’ moments.
Filtering and displaying your data.
JQL is Jira’s proprietary query language. It is used to filter and return results. It looks and sounds a bit like SQL, but JQL has it’s own set of constraints.
In SQL, retrieving and displaying can be performed in the same function. JQL, on the other hand, is only for retrieval (‘order by’ being the one fuzzy exception). This is why JQL has no ‘group by’ function and why displaying and manipulating data right in JQL is extremely limited.
Jira intends data to only be retrieved via JQL, but then displayed by other means.
Displaying your data with Jira Widgets
One of the main options within Jira for displaying retrieved data are dashboard widgets. These are geared towards software development rather than data analysis so I found most of them irrelevant, but a few that were useful are:
- The ‘Count’ dashboard widget. It will display a dynamic number for any custom query you input. Want to know how many positive observations have been recorded for the label “search”? Count is the widget for you.
- I also use the heatmap with the ‘Labels’ field selected. The heatmap widget performs a “group by” function based on a selected field. I use the heatmap to display the most used labels (which we use to tag our observations). Its not a deep dive but does give a quick look at what labels have the most traction.
- Pie Charts also group by a selected field. Like heatmaps, we use pie charts to get a quick, broad strokes glance at what components or labels are most used.
In order to use the widgets above you will need to first save your own custom filters (search results). The steps are easy: Go to Issues and do a search, then click “save as” at the top of the results page, above the filter field. You can reuse your saved filters when configuring a dashboard, your sidebar, and the quick filters in your boards.
Useful JQL filters
Once you get the hang of the language setting up filters in Jira is easy. You can see the raw JQL of your queries anytime by clicking “switch to JQL” next to the search field. Below are a few examples of useful filters I use.
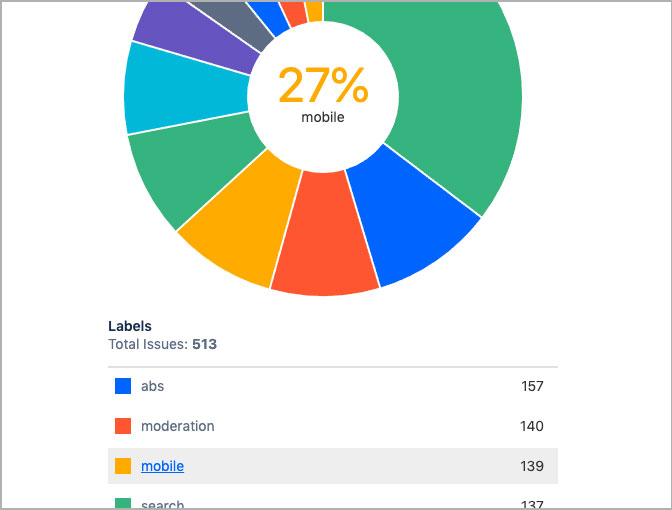
This query filters positive observations that have labels. I use it with the pie chart widget and group by label to see which are getting the most traction and are likely to yield insights:
project = AUXH AND issuetype = Observation AND “UX Experience Vector” = Positive AND Labels != none
This “triple fire alarm” query returns negative observations with a high magnitude that happen frequently:
project = AUXDH AND issuetype = Observation AND “UX Experience Vector” = Negative AND “UX Experience Magnitude” = High AND (“UX Event Frequency” = Often OR “UX Event Frequency” = Constant)
This filter selects a range of issues based on their key, which is useful for analyzing specific survey results. I always batch import them so they share a clean range of IDs:
project=AUXDH AND issuekey>=AUXDH-232 AND issuekey<=AUXDH-318 AND creator=currentUser()
There are endless permutations of filter options and techniques you can use. The best way to quickly become familiar with JQL syntax is just by playing around with your data and widgets.
Branching out with complementary tools
When we need a deeper analysis we bump up against the limitations of JQL and Jira widgets and need to branch out. We can export the data as a csv from Jira and analyze it in various other tools. Some on our preffered list are Pandas, google charts, excel, and we recently added Tableau. First export the results you want to analyze as a csv file, then import it into the analysis tool of your choice.
Analyzing research is an artform in itself, as is visualizing data (just ask Edward Tufte). The real magic happens in your understanding of your research as it accumulates. I think when we focus on finding the right research repository tool for gaining those insights, then the best way to present them will follow.
Conclusion
If your team is using Jira already you might benefit from keeping user research results at everyone’s fingertips, as we did. For my organization, the biggest drawback of Jira are the limits of JQL, while the greatest benefit is the high level of distributed access we can achieve in our organization. For us, the increased access and engagement outweighed the drawbacks and this repository has met our needs.
Resources
Metzler, Brigette. “Harry Beck, Research Repositories & Getting People to the Station.” Medium, 13 May 2019, uxdesign.cc/harry-beck-research-repositories-getting-people-to-the-station-325b8b57f4be.
Francis, Naomi. “An Interview with Kate Towsey, ResearchOps Manager at Atlassian.” Marvel Blog, 12 Aug. 2020, marvelapp.com/blog/kate-towsey-researchops-atlassian.
Sharon, Tomer. “Foundations of Atomic Research.” Medium, 16 Mar. 2018, tsharon.medium.com/foundations-of-atomic-research-a937d5da5fbb.
Richardson, Jonathan. “I Built a User Research Repository — You Should Do the Same.” Medium, 25 Sept. 2020, medium.com/researchops-community/i-built-a-user-research-repository-you-should-do-the-same-df680e140df8.
ResearchOps. “#WhatisResearchOps.” Mural.Co, app.mural.co/t/researchopscommunity7839/m/researchopscommunity7839/1539419866773/d21dd2cce77e9e502dcdb46c4abfa7ad8a0aff88. Accessed 4 Feb. 2021.